Eclipse Ditto Benchmark
Published by 
This blog post is presenting a benchmark of Eclipse Ditto. It consists of a few scenarios to cover most important ditto functionalities, test the performance and provide a tuning guide. This benchmark is done via the benchmark-tool, based on k6 load testing tool
Setup and used tools
-
EKS cluster using m5.4xlarge nodes.
-
Deployed Ditto using ditto’s official helm chart, version 3.0.0, ditto version 3.3.5.
-
Deployed bitnami kafka helm chart, version 23.0.7, kafka version 3.4.0.
-
Deployed MMock instance - used as a ‘dummy’ receiver for ditto events and device commands.
-
k6 - load testing tool, used to implement the benchmark scenarios.
-
Deployed k6-operator - Kubernetes operator for running distributed k6 tests.
Scenarios
The benchmark test consists of 4 test scenarios that can be executed independently and in parallel:
-
READ_THINGS - read things via HTTP ( get things by id )
-
SEARCH_THINGS - search things via HTTP ( get things by applying search filter )
-
MODIFY_THINGS - Modify things by sending ditto protocol kafka messages to specfic topic. Ditto kafka connection is reading from this topic and processes the messages. Ditto HTTP push connection is configured in ditto, which sends events from topic /things/twin/events?filter=eq(topic:action,’modified’) to a monster mock endpoint, which replies with HTTP status code 204.
-
DEVICE_LIVE_MESSAGES - Send live messages to things via HTTP. Ditto HTTP push connection is configured, which sends events from topic /things/live/messages to a monster mock endpoint, which replies with predefined ditto protocol message.
Preparation
1 000 000 things are created with the benchmark-tool by sending Ditto protocol messages to the topic that a Ditto Kafka connection is configured to read from. This connection has an implicitThingCreation mapper configured.
The thing template, configured in the connection mapper looks like the following:
{
  "thing": {
    "thingId": "{{ header:device_id }}",
    "_policy": {
      "entries": {
        "DEVICE": {
          "subjects": {
            "nginx:ditto": {
              "type": "does-not-matter"
            }
          },
          "resources": {
            "policy:/": {
              "revoke": [],
              "grant": [
                "READ",
                "WRITE"
              ]
            },
            "thing:/": {
              "revoke": [],
              "grant": [
                "READ",
                "WRITE"
              ]
            },
            "message:/": {
              "revoke": [],
              "grant": [
                "READ",
                "WRITE"
              ]
            }
          }
        }
      }
    },
    "definition": "org.eclipse.ditto:coffeebrewer:0.1.0",
    "attributes": {
      "location": "test location",
      "model": "Speaking coffee machine"
    },
    "features": {
      "coffee-brewer": {
        "properties": {
          "brewed-coffees": 0
        }
      }
    }
  }
}
Example created thing looks like the following:
{
    "thingId": "org.eclipse.ditto:test-thing-1",
    "policyId": "org.eclipse.ditto:test-thing-1",
    "definition": "org.eclipse.ditto:coffeebrewer:0.1.0",
    "attributes": {
        "location": "test location",
        "model": "Speaking coffee machine"
    },
    "features": {
        "coffee-brewer": {
            "properties": {
                "brewed-coffees": 0
            }
        }
    }
}
Warmup
Before executing the scenarios, a special ‘warmup’ scenario is executed. It is making ‘GET’ requests so that entities are loaded in memory and caches are populated in order to provide optimal performance.
Heap memory needed according to number of things:
-
10 000 hot things ~1.8GB for things service and ~1GB for policies service.
-
100 000 hot things - ~3.5GB for things service and ~3GB policies
-
300 000 hot things - ~5GB for things service and ~5GB for policies service
-
1 000 000 hot things - ~16GB for things service and ~15GB for policies service
The size varies, depending on the size of the things and policies.
The scenarios are run with 100 000 warmed up things.
Scenarios run
All services use the following java vm options:
-XX:InitialHeapSize=5g
-XX:MaxHeapSize=5g
-XX:MaxRAMPercentage=75
-XX:ActiveProcessorCount=16
The scenarios run for 10 minutes each, screenshots are taken from Grafana, from exposed ditto metrics.
Read things
This scenario executes HTTP GET requests for reading things by id, like so:
${DITTO_BASE_URI}/things/org.eclipse.ditto:test-thing-1
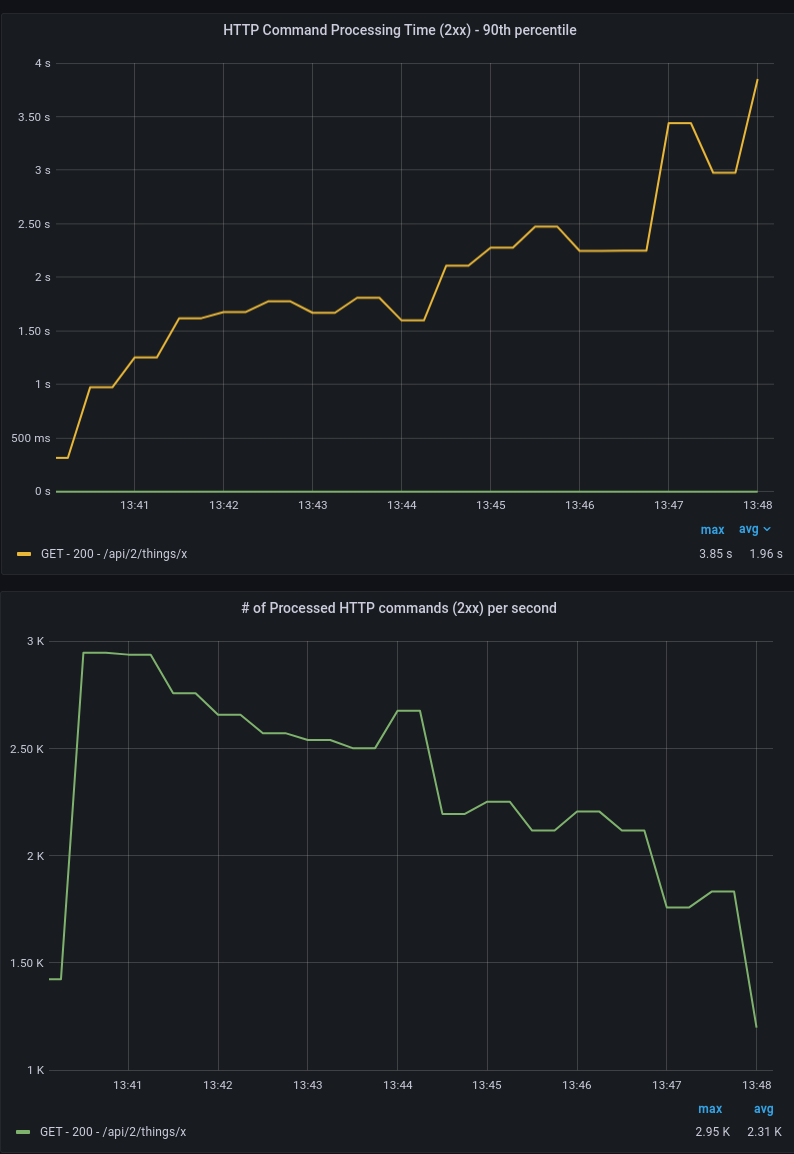
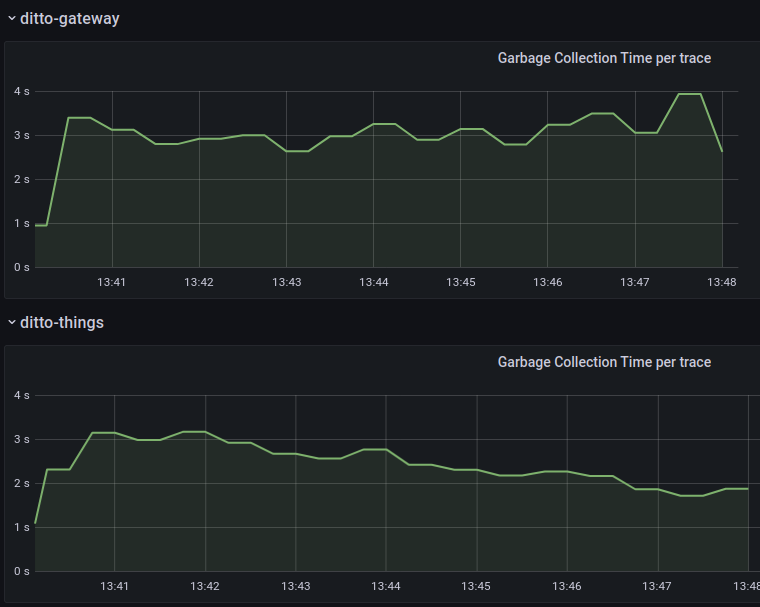
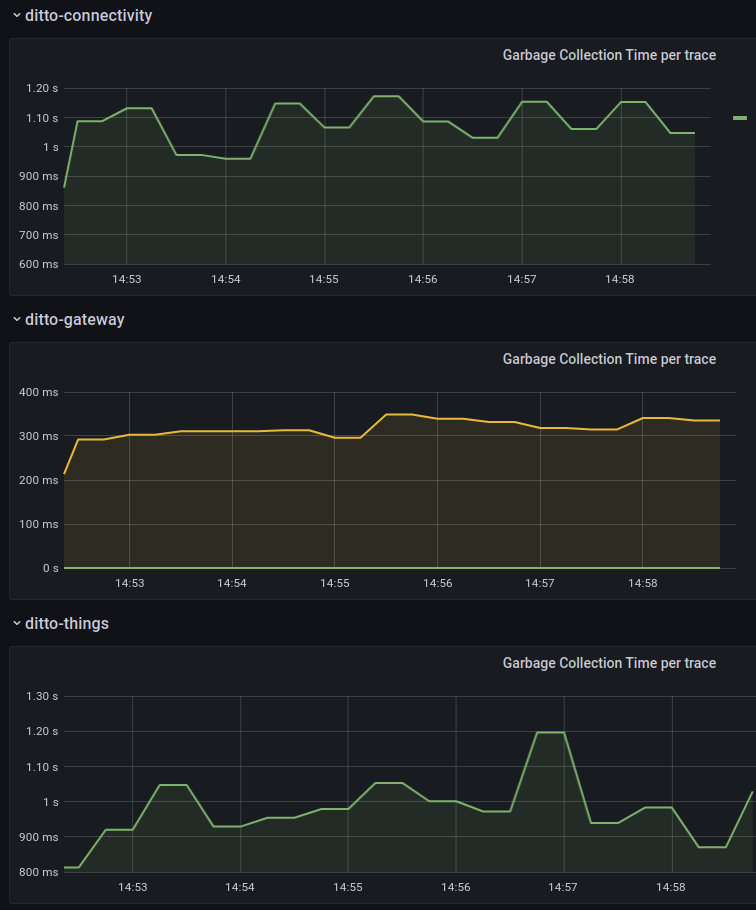
The tests show that with single instance of each service, it is possible to perform ~2800 reads/s. Attempting more, results in high garbage collection time and drop in performance which can be seen in the “GC” and “Gateway Traces” dashboards.
 |
 |
|---|
Scaling gateway to 2 instances results in only ~3500 reads/s, because of high GC time for things service - ~5s. Scaling things service to 2 instances results in ~5600 reads/s. A maximum of 8400 reads/s was possible with 3 gateways and 2 things instances.
| Setup | 1 instance of each service | 2 gateway, 1 instance each else | 2 gateway, 2 things, 1 instance each else | 3 gateway, 2 things, 1 instance each else |
|---|---|---|---|---|
| Reads/s | ~2800 | ~3500 | ~5600 | ~8400 |
| Command Processing Time(ms) | ~80 | ~2000 | ~50 | ~70 |
Search things
This scenario executes HTTP GET requests for searching things by id like so:
${DITTO_BASE_URI}/search/things?filter=eq(thingId, 'org.eclipse.ditto:test-thing-1')
In this scenario, things-search service is used to perform a search query for things, based on the provided filter.
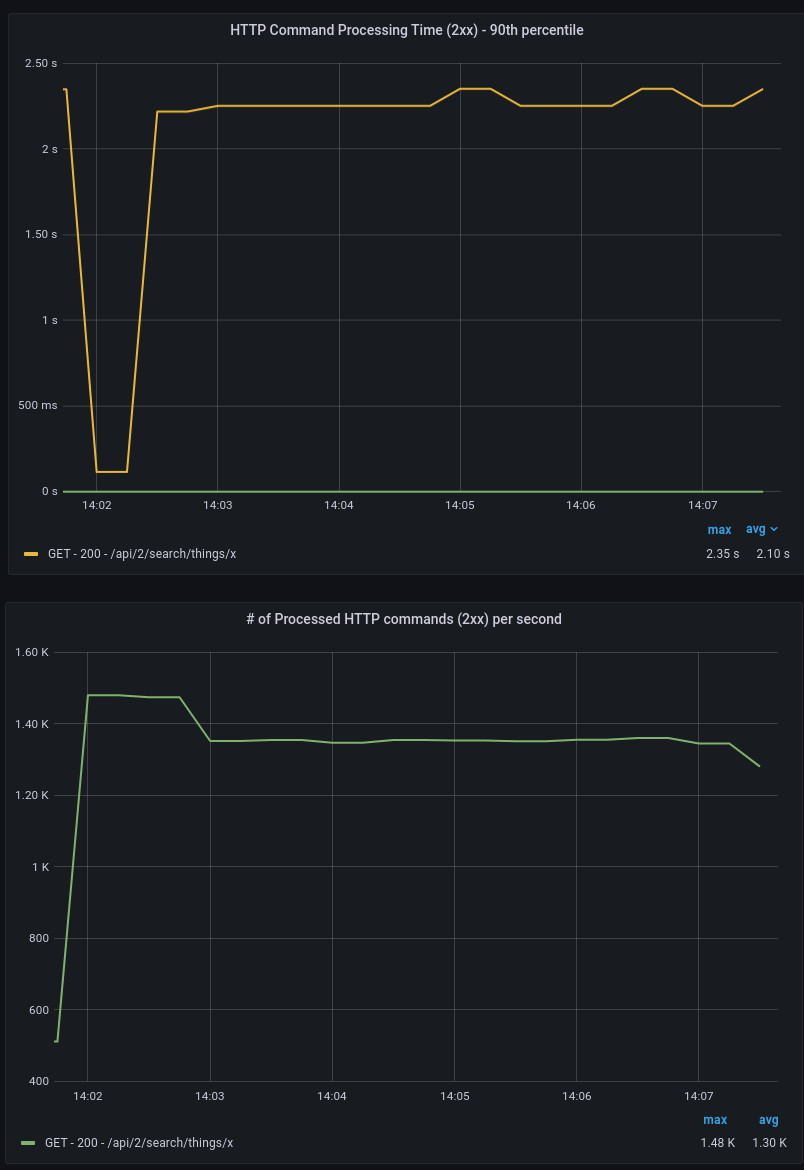
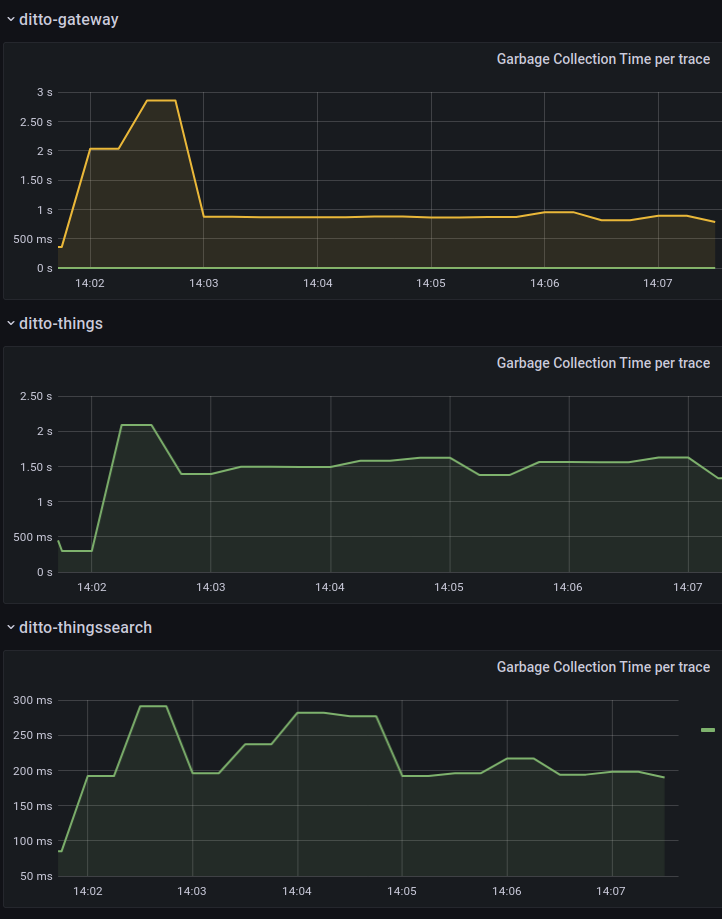
The tests show that with single instance of each service, it is possible to perform ~1700 searches/s. Attempting more results in high garbage collection time and drop in performance, as can be seen in “GC” and “Gateway Traces” dashboards.
 |
 |
|---|
With single instance of things service and 2 instances of gateway service, a maximum of ~2400 searches/s can be performed, with high GC time for things service - ~3s. Scaling things to 2 instances results in ~3400 searches/s. Scaling to 3 gateways does not show expected performance, because the nodes things pods run on have high CPU usage - ~90%. To perform more searches, nodes with more CPUs are needed.
| Setup | 1 instance of each service | 2 gateway, 1 instance each else | 2 gateway, 2 things, 1 instance each else | 3 gateway, 2 things, 1 instance each else |
|---|---|---|---|---|
| Searches/s | ~1700 | ~2400 | ~3400 | ~4900 |
| Command Processing Time(ms) | ~70 | ~100 | ~50 | ~100 |
Modify things
This scenario sends ditto protocol kafka messages, which cause twin modifies.
Example message:
device_id:org.eclipse.ditto:test-thing-1,ditto_message:y!{"topic":"org.eclipse.ditto/test-thing-1/things/twin/commands/modify","path":"features/coffee-brewer/properties/brewed-coffees","value":"10"}
In this scenario, connectivity service is used to create a ditto kafka connection, which reads messages from the provided topic, maps them to a ditto modify command and forwards it to things service. The things service then executes mongodb update query and generates the thing modified event, which is pushed to the MMock service instance via an HTTP Push connection. Also, the kafka connection is configured with qos=1, which means if there is no acknowledgement that the thing is persisted, the operation will be retried.
The HTTP Push connection looks like the following:
{
  "id": "a70c0749-261a-474b-9fb2-8fff7bd84fb4",
  "name": "http-push-connection",
  "connectionType": "http-push",
  "connectionStatus": "open",
  "uri": "http://mmock-service:80",
  "sources": [],
  "targets": [
    {
      "address": "POST:/{{ thing:id }}",
      "topics": [
        "_/_/things/twin/events?filter=eq(topic:action,'modified')"
      ],
      "authorizationContext": [
        "nginx:ditto"
      ],
      "headerMapping": {}
    }
  ],
  "clientCount": 1,
  "failoverEnabled": true,
  "validateCertificates": true,
  "processorPoolSize": 1,
  "specificConfig": {
    "parallelism": "1"
  },
  "tags": [
    "benchmark"
  ]
}
The kafka connection looks like the following:
{
  "id": "4cd191cc-aabb-4965-a1b4-dfe8ae8674bc",
  "name": "kafka-source",
  "connectionType": "kafka",
  "connectionStatus": "open",
  "uri": "tcp://bitnami-kafka:9092",
  "sources": [
    {
      "addresses": [
        "create-update"
      ],
      "consumerCount": 1,
      "qos": 0,
      "authorizationContext": [
        "nginx:ditto"
      ],
      "enforcement": {
        "input": "{{ header:device_id }}",
        "filters": [
          "{{ entity:id }}"
        ]
      },
      "headerMapping": {},
      "payloadMapping": [
        "ditto"
      ],
      "replyTarget": {
        "enabled": false
      }
    }
  ],
  "targets": [],
  "clientCount": 1,
  "failoverEnabled": true,
  "validateCertificates": true,
  "processorPoolSize": 1,
  "specificConfig": {
    "saslMechanism": "plain",
    "bootstrapServers": "bitnami-kafka:9092"
  },
  "mappingDefinitions": {
    "ditto": {
      "mappingEngine": "Ditto",
      "options": {
        "thingId": "{{ header:device_id }}"
      },
      "incomingConditions": {
        "sampleCondition": "fn:filter(header:ditto_message,'exists')"
      }
    }
  },
  "tags": [
    "benchmark"
  ]
}
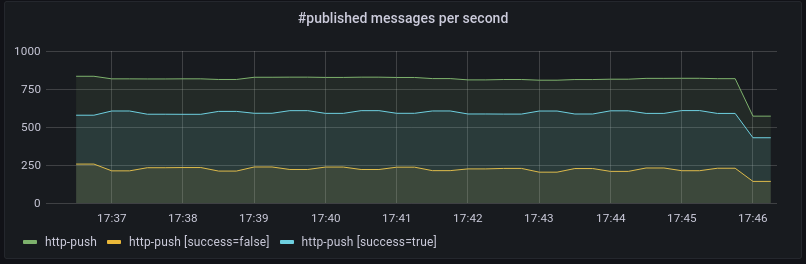
By default, the ditto kafka consumer is throttled with limit of 100 number of messages/s per consumer. This is configured by the KAFKA_CONSUMER_THROTTLING_LIMIT env variable. This value is changed to 1000, since with the current setup, more than 500 messages can be processed. Single connectivity instance is able to perform ~800 modifies/s. However, “Outbound Message rates” panel shows failed published messages from our HTTP Push connection, and the following is observed from our connection logs:
Ran into a failure when publishing signal: Outgoing HTTP request aborted: There are too many in-flight requests. This can have the following reasons:\na) The HTTP endpoint does not consume the messages fast enough.\nb) The client count and/or the parallelism of this connection is not configured high enough.
 |
|---|
Increasing the connection parallelism from 1(default) to 2 solves this issue and all outbound messages are sent without fails.
...
"connectionType": "http-push",
"specificConfig": {
    "parallelism": "2"
  },
...
Attempting more modifies/s does not result in better performance, the ditto kafka connection consumes at the same rate of 800 messages/s.
Scaling connectivity instance and changing our connection to have clientCount equal to number of connectivity instances solves the GC issue. Performing 1600 modifies/s also results in high garbage collection time(~2s) for things and things-search services. This is the maximum that can be achieved with single things and things-search services. Scaling things and things-search solves the GC issue. Further scaling of connectivity results in only ~1800 modifies/s, because MongoDB’s write tickets get exhausted, as can be seen in the MongoDB ‘Tickets Available’ metric. Scaling MongoDB to higher CPU instance(M50 General, 8 cpu) solves the issue and ~2400 modifies/s are possible.
| Setup | 1 instance of each service | 2 connectivity, 1 instance each else | 3 connectivity, 2 things, 2 things-search, 1 instance each else | 4 connectivity, 2 things, 2 things-search, 1 instance each else |
|---|---|---|---|---|
| Modifies/s | ~800 | ~1600 | ~2400 | ~3200 |
| Signal Processing Times(ms) | ~15 | ~80 | ~10 | ~20 |
| ACK Times(ms) | ~40 | ~250 | ~50 | ~100 |
Device live messages(commands)
This scenario executes HTTP POST requests to ditto’s live channel. An HTTP Push connection is subscribed for them and in turn pushes to a MMock instance that acts as a ‘dummy’ device receiver of live messages/commands and simply responds with pre-configured ditto response.
The HTTP POST request looks like the following:
URL: ${DITTO_THINGS_URI}/org.eclipse.ditto:test-thing-1/inbox/messages/someSubject
Request Body: "anyMessage"
MMock pre-configured response looks like the following:
{
  "topic": "{{request.body.topic}}",
  "status": "200",
  "value": "ok",
  "path": "{{request.body.path}}",
  "headers": {
    "correlation-id": "{{request.body.headers.correlation-id}}",
    "content-type": "application/json"
  }
}
The HTTP Push connection looks like the following:
{
  "id": "a70c0749-261a-474b-9fb2-8fff7bd84fb4",
  "name": "http-push-connection",
  "connectionType": "http-push",
  "connectionStatus": "open",
  "uri": "http://mmock-service:80",
  "sources": [],
  "targets": [
    {
      "address": "POST:/live_messages",
      "topics": [
        "_/_/things/live/messages"
      ],
      "authorizationContext": [
        "nginx:ditto"
      ],
      "headerMapping": {}
    }
  ],
  "clientCount": 1,
  "failoverEnabled": true,
  "validateCertificates": true,
  "processorPoolSize": 1,
  "specificConfig": {
    "parallelism": "1"
  },
  "tags": [
    "benchmark"
  ]
}
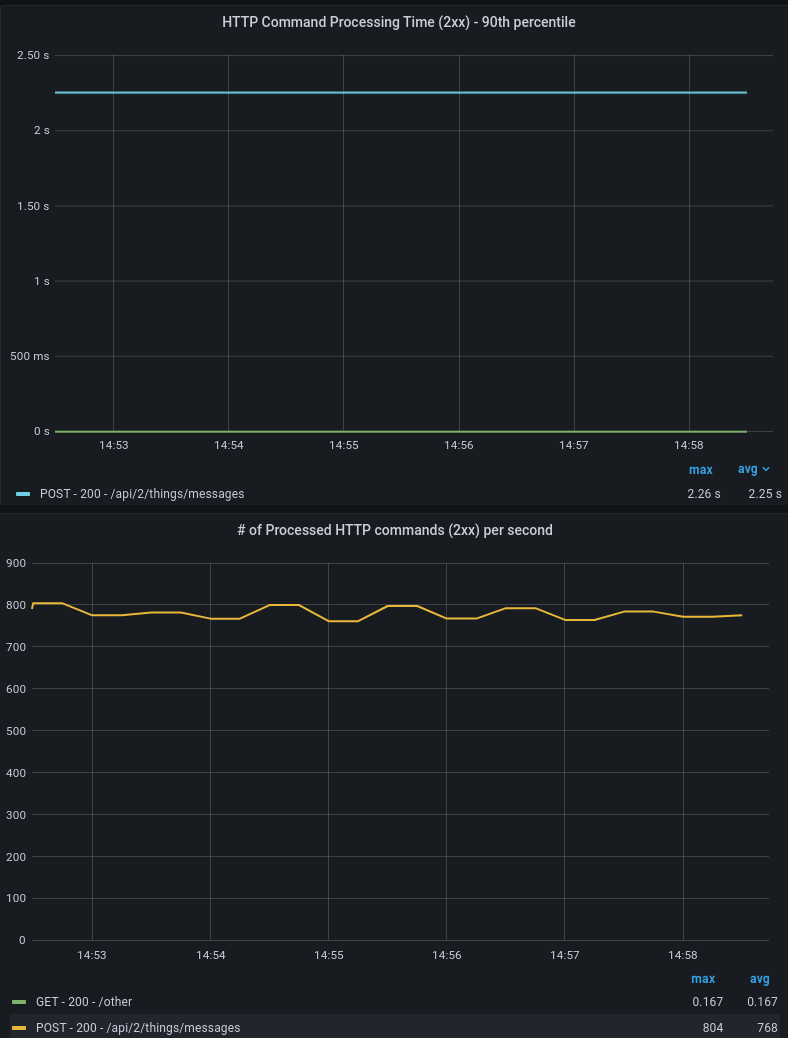
The tests show that a single connectivity instance is able to perform ~600 live messages/s. Attempting more results in high garbage collection time and high Command Processing Time, as can be seen in “GC” and “Gateway Traces” dashboards.
 |
 |
|---|
Scaling the instances and increasing the value of connection clientCount solves the GC issue and doubles the messages/s. Performing more than 2400 live messages/s also results in high garbage collection time for things and gateway services and this is the maximum with single things and gateway services. Scaling things and gateway solves the issue and results in ~3000 live messages/s.
| Setup | 1 instance of each service | 2 connectivity, 1 instance each else | 3 connectivity, 1 instance each else | 4 connectivity, 1 instance each else | 5 connectivity, 2 things, 2 gateway, 1 instance each else |
|---|---|---|---|---|---|
| Live messages/s | ~600 | ~1200 | ~1800 | ~2400 | ~3000 |
| Command Processing Time(ms) | ~50 | ~50 | ~100 | ~240 | ~50 |
| Signal Processing Times(ms) | ~15 | ~15 | ~40 | ~90 | ~20 |
Additional tuning properties, not used in the scenarios
Ditto ‘tuning’ environment variables, that were not mentioned, because those cases were never hit, while executing the scenarios.
THING_PERSISTENCE_ACTOR_MAILBOX_SIZE - Used for special actor mailbox, which handles ThingModifyCommands, see org. eclipse.ditto.things.service.persistence.actors.ThingPersistenceActorMailbox. If number of messages is more than the mailbox capacity, modify command results in error, like the following:
Too many modifying requests are already outstanding to the Thing with ID 'org.eclipse.ditto:test-thing-1'.
REMOTE_OUTBOUND_MESSAGE_QUEUE_SIZE - See https://doc.akka.io/docs/akka/current/general/configuration-reference.html
        # Size of the send queue for outgoing messages. Messages will be dropped if
        # the queue becomes full. This may happen if you send a burst of many messages
        # without end-to-end flow control. Note that there is one such queue per
        # outbound association. The trade-off of using a larger queue size is that
        # it consumes more memory, since the queue is based on preallocated array with
        # fixed size.
        outbound-message-queue-size = 3072
If this limit is hit, the following error log will appear:
Message [org.eclipse.ditto.things.model.signals.commands.modify.ModifyAttribute] from Actor
[akka://ditto-cluster/temp/thingProxy$AsP9C] to Actor[akka://ditto-cluster@10.0.157.
154:2552/system/sharding/thing#362290016] was dropped. Due to overflow of send queue, size [3072]. [10] dead letters
encountered, no more dead letters will be logged in next [5.000 min]. This logging can be turned off or adjusted
with configuration settings 'akka.log-dead-letters' and 'akka.log-dead-letters-during-shutdown'.